Detailed Explanation of SAT Scores
Author
Hartwell
Date Published

The SAT Suite of Assessments
How the SAT Suite of Assessments Works
The SAT Suite of Assessments is an integrated system of tests that includes the SAT (for students in grades 11 and 12), the PSAT/NMSQT and the PSAT 10 (for grades 10 and 11), and the PSAT 8/9 (for grades 8 and 9). The tests measure the same skills and knowledge in grade and career appropriate ways. They work together to show college readiness over time, so educators, students, and parents can monitor student progress. Their content reflects the kind of meaningful, engaging, and challenging work that students find in middle school and high school courses taught today.
How the SAT is Organized
The digital SAT Suite uses multistage adaptive testing (MST). Relying on MST means we can fairly and accurately measure the same things with a shorter, more secure test while preserving test reliability. Both the Reading and Writing section and the Math section are divided into 2 equal length and separately timed stages, each composed of a module of questions. The first module contains a mix of easy, medium, and hard questions. Based on how a student performs on the first module, the second module of questions will either be more difficult or less difficult. By adapting to a student’s performance level, the responsive test will provide students with a more efficient assessment of their academic strengths.
How the SAT Is Scored
The SAT Suite uses adaptive test design with item response theory (IRT) pattern scoring. Adaptive testing allows for fewer questions, in less time, than traditional paper tests. Pattern scoring allows for precise measurement of students’ knowledge and skills. Students’ scores are determined by whether they answer questions right or wrong, and by considering attributes of the questions, including difficulty level, the questions’ ability to differentiate between students with various levels of content knowledge, and the probability that a student is guessing based on their pattern of responses. Every test includes a standardized set of question types and measures the same content domains, so all students have equitable opportunity to demonstrate their strengths. For most students who are trying their best on every question, it is better to guess than leave a question blank, especially if the student can eliminate 1 or 2 answer options before guessing.
SAT Scores
Accessing Official Student Scores
Your student’s school has access to a downloadable PDF called Your Score Report for every SAT test taker. Students can review this score report with educators at their school and share it with their families.
Students who took the SAT and provided a mobile phone number during testing can view their scores on the BigFuture School app.
As always, students age 13 and older may use a personal College Board student account to view additional insights online.
Using SAT Scores to Predict Scores on Other Assessments
The SAT Suite—from the PSAT 8/9 through the SAT—uses a common score scale for the total and section scores. The ranges reported for each assessment reflect grade-level appropriateness within the common score scale.
This common score scale means that a student who took the SAT and received a Math section score of 500 would be expected to also get a 500 on the PSAT/NMSQT, the PSAT 10, or the PSAT 8/9 if they had taken any of those tests on that same day; a score of 500 represents the same level of academic achievement on all 4 assessments.
This also means that student growth across the SAT Suite is easy to determine. If a student took the PSAT/NMSQT or PSAT 10 last year and received a 500 Math section score, then took the SAT this year and earned a 550 Math section score, that student has shown a growth of 50 points, which likely resulted from hard work both in and out of school.
The SAT Score Report
Below is an example of a student's SAT score report. This transcript can better help you understand the content of the transcript.
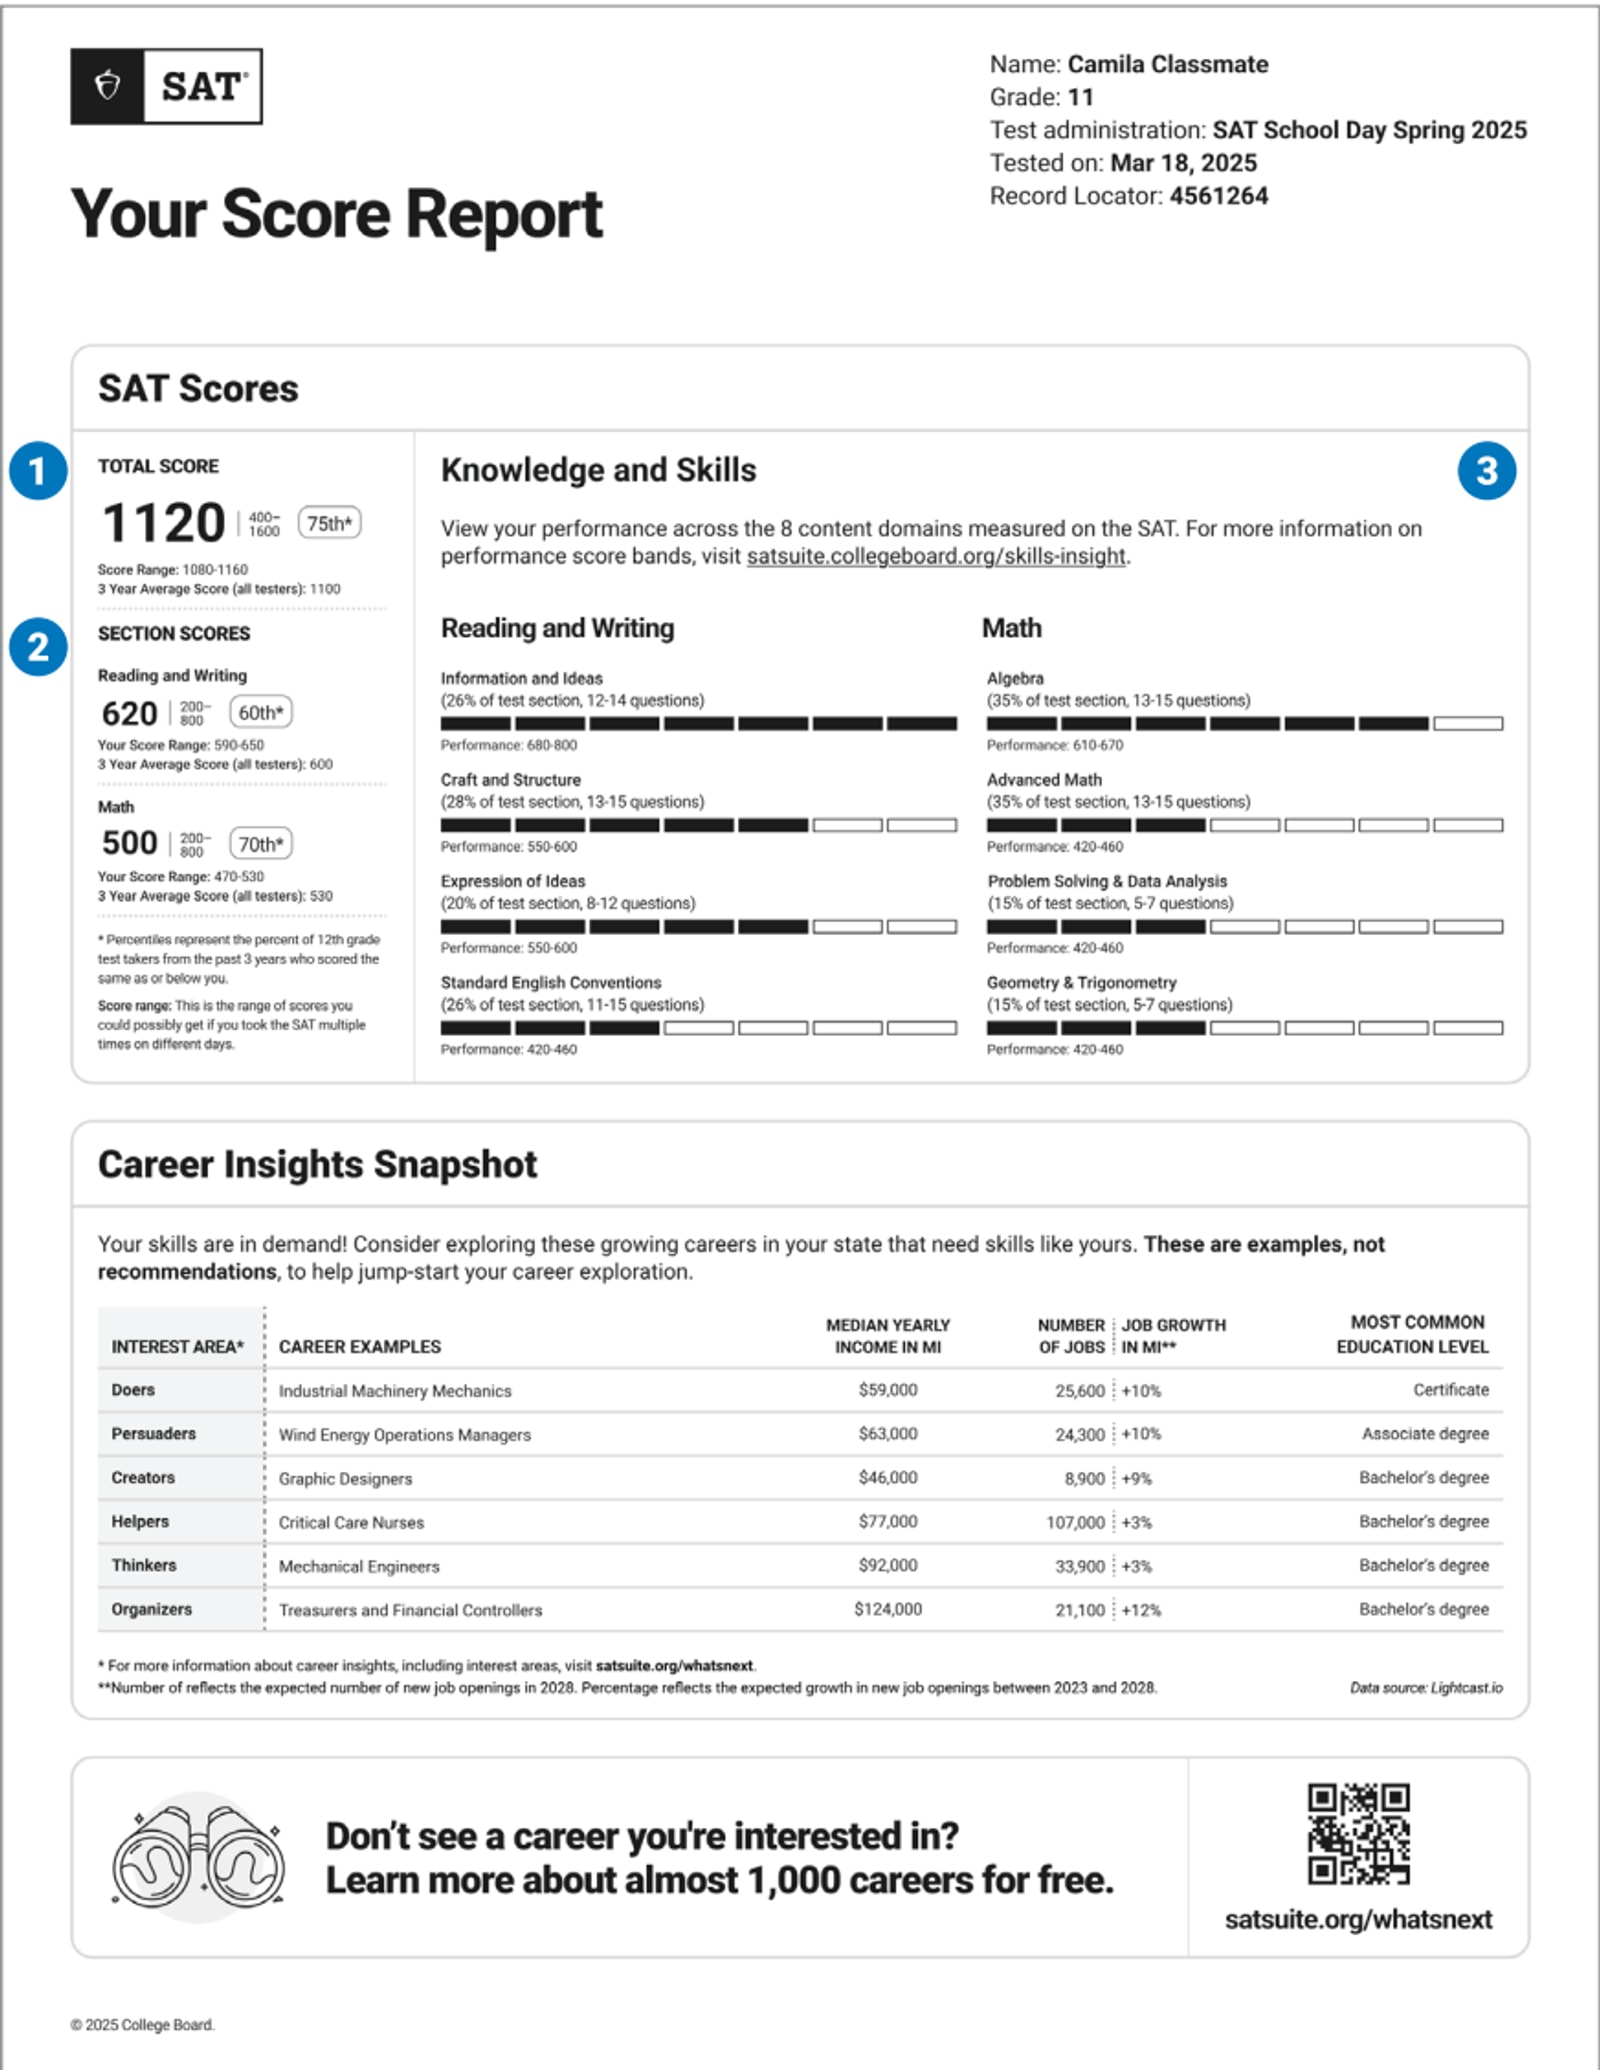
1. WHAT ARE CAMILA’S SCORES?
Camila’s Reading and Writing score is 620, and her Math score is 500, for a total score of 1120. Below her individual scores, she can see a score range, which shows the range of scores she might expect to get if she took the SAT multiple times. She can also see an average score of all testers in any grade who have taken the SAT in the last 3 years.
2.WHAT ARE CAMILA’S SCORE PERCENTILES?
Camila is in 11th grade, but the percentiles compare her scores with those of SAT testers in 12th grade from the last 3 years, including all SAT Weekend and SAT School Day administrations. Camila scored as well or better in Reading and Writing than 60% of all 12th-grade test takers around the world. In Math, she scored as well or better than 70% of all 12th-grade test takers. Putting both scores together, Camila scored as well or better than 75% of students in 12th grade on the SAT as a whole.
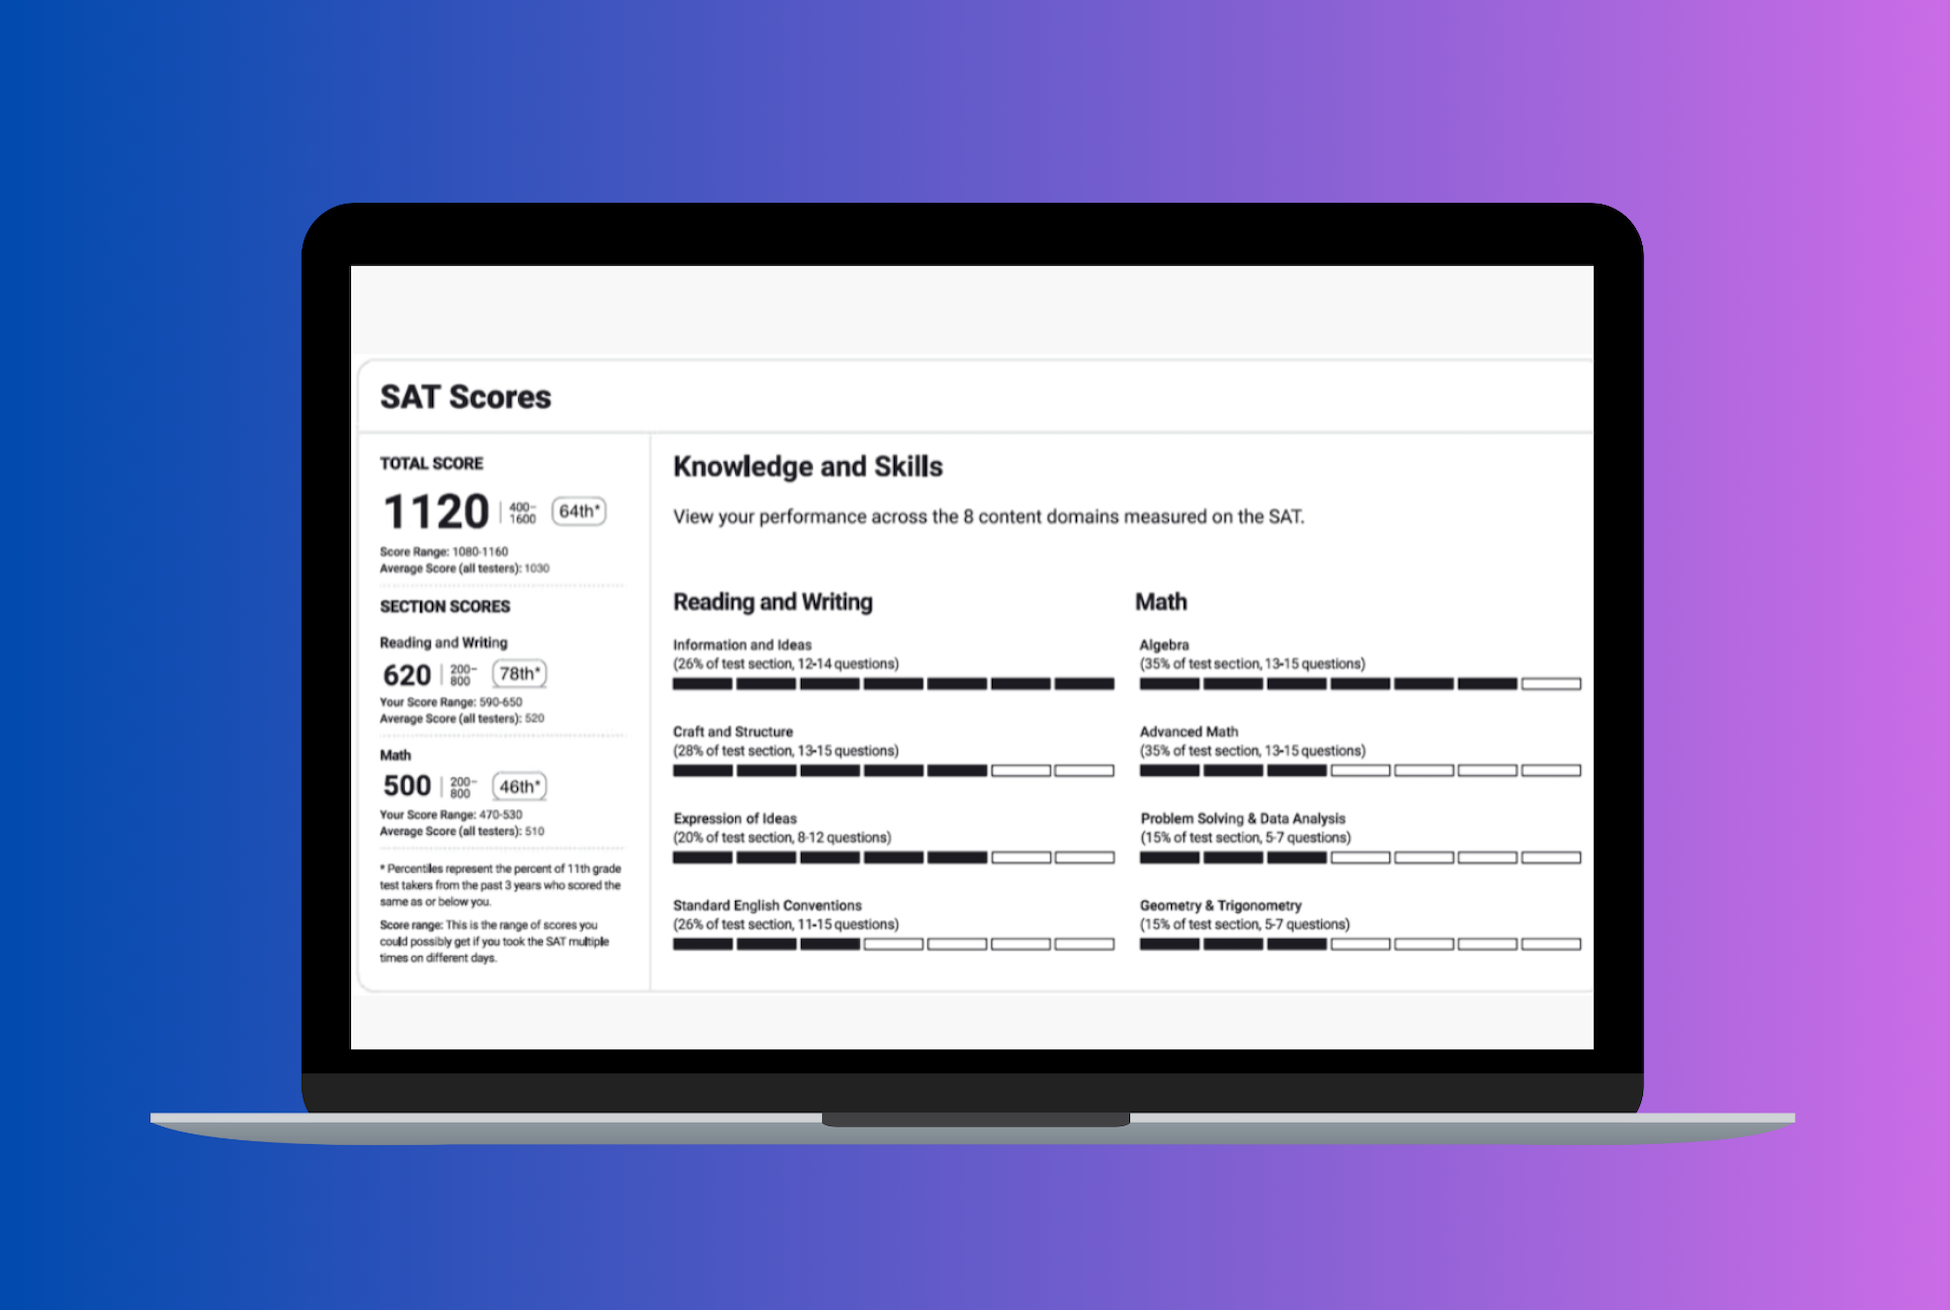
3.WHAT CAN CAMILA LEARN FROM THIS KNOWLEDGE AND SKILLS SECTION?
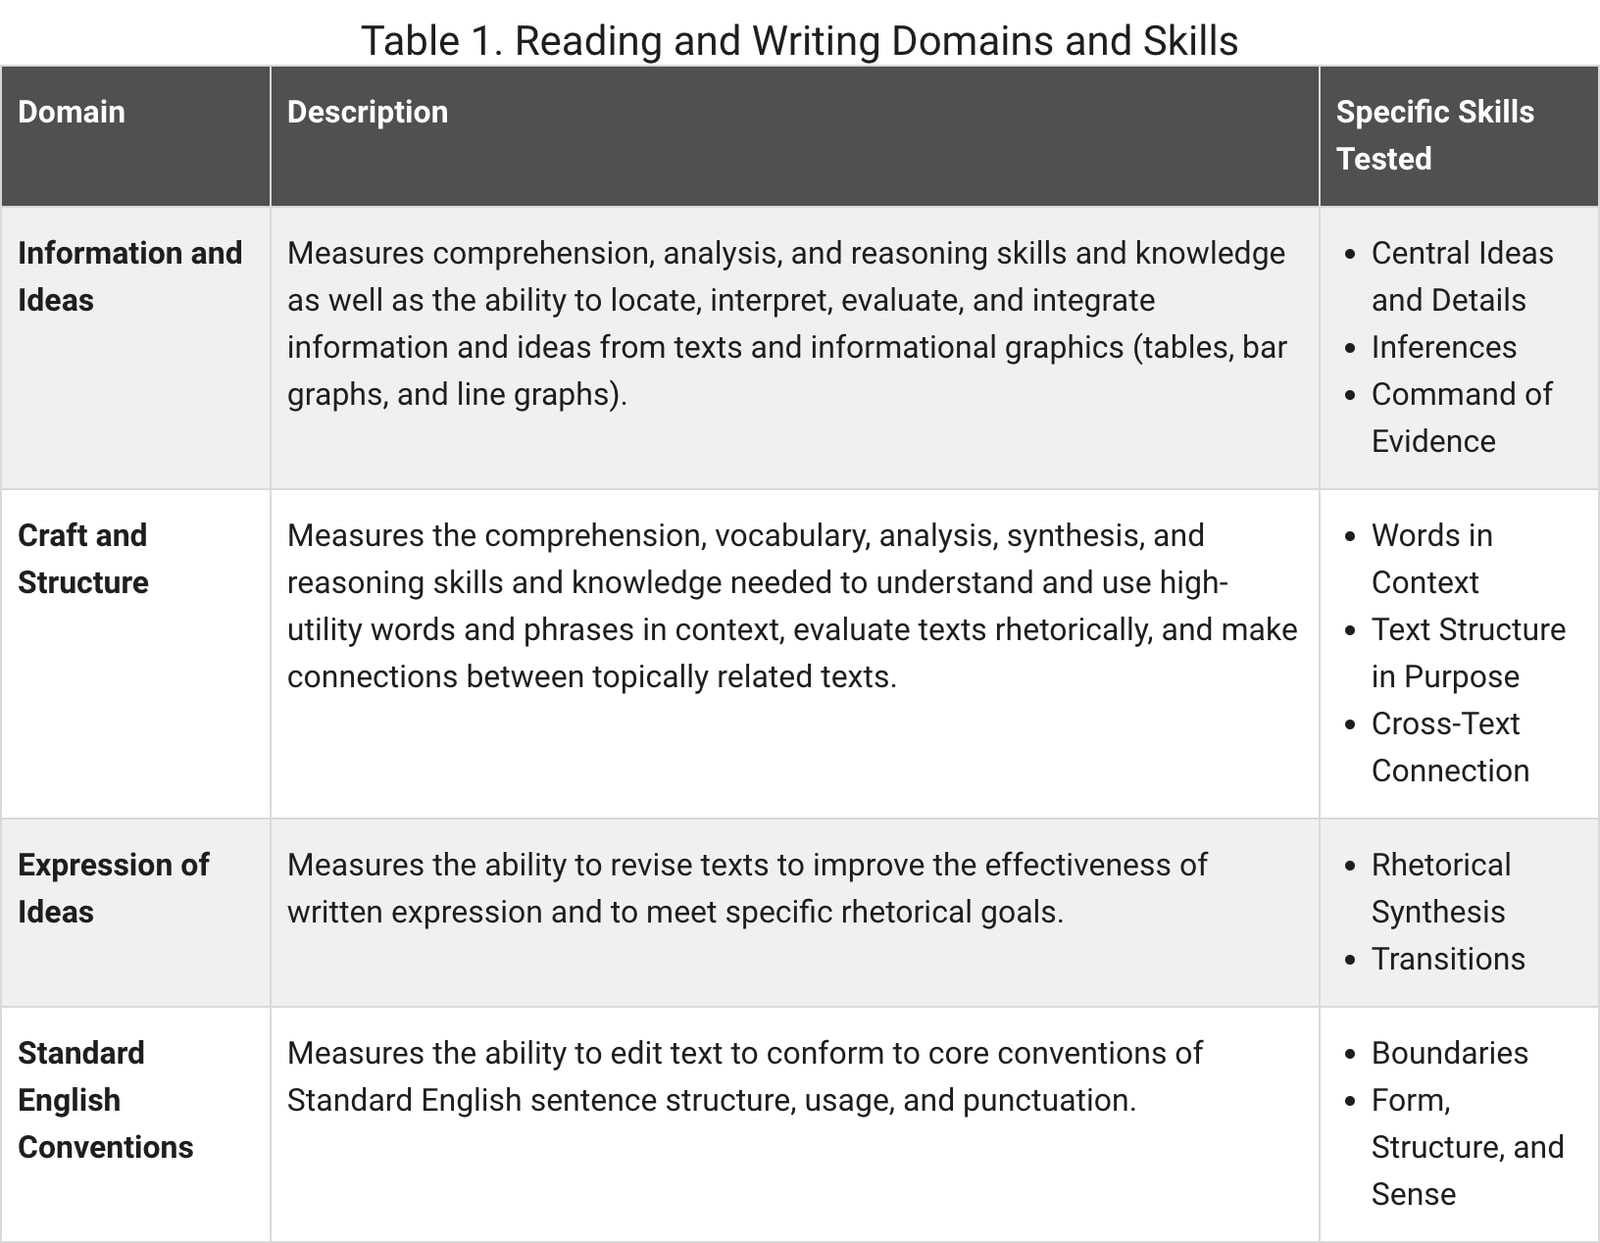
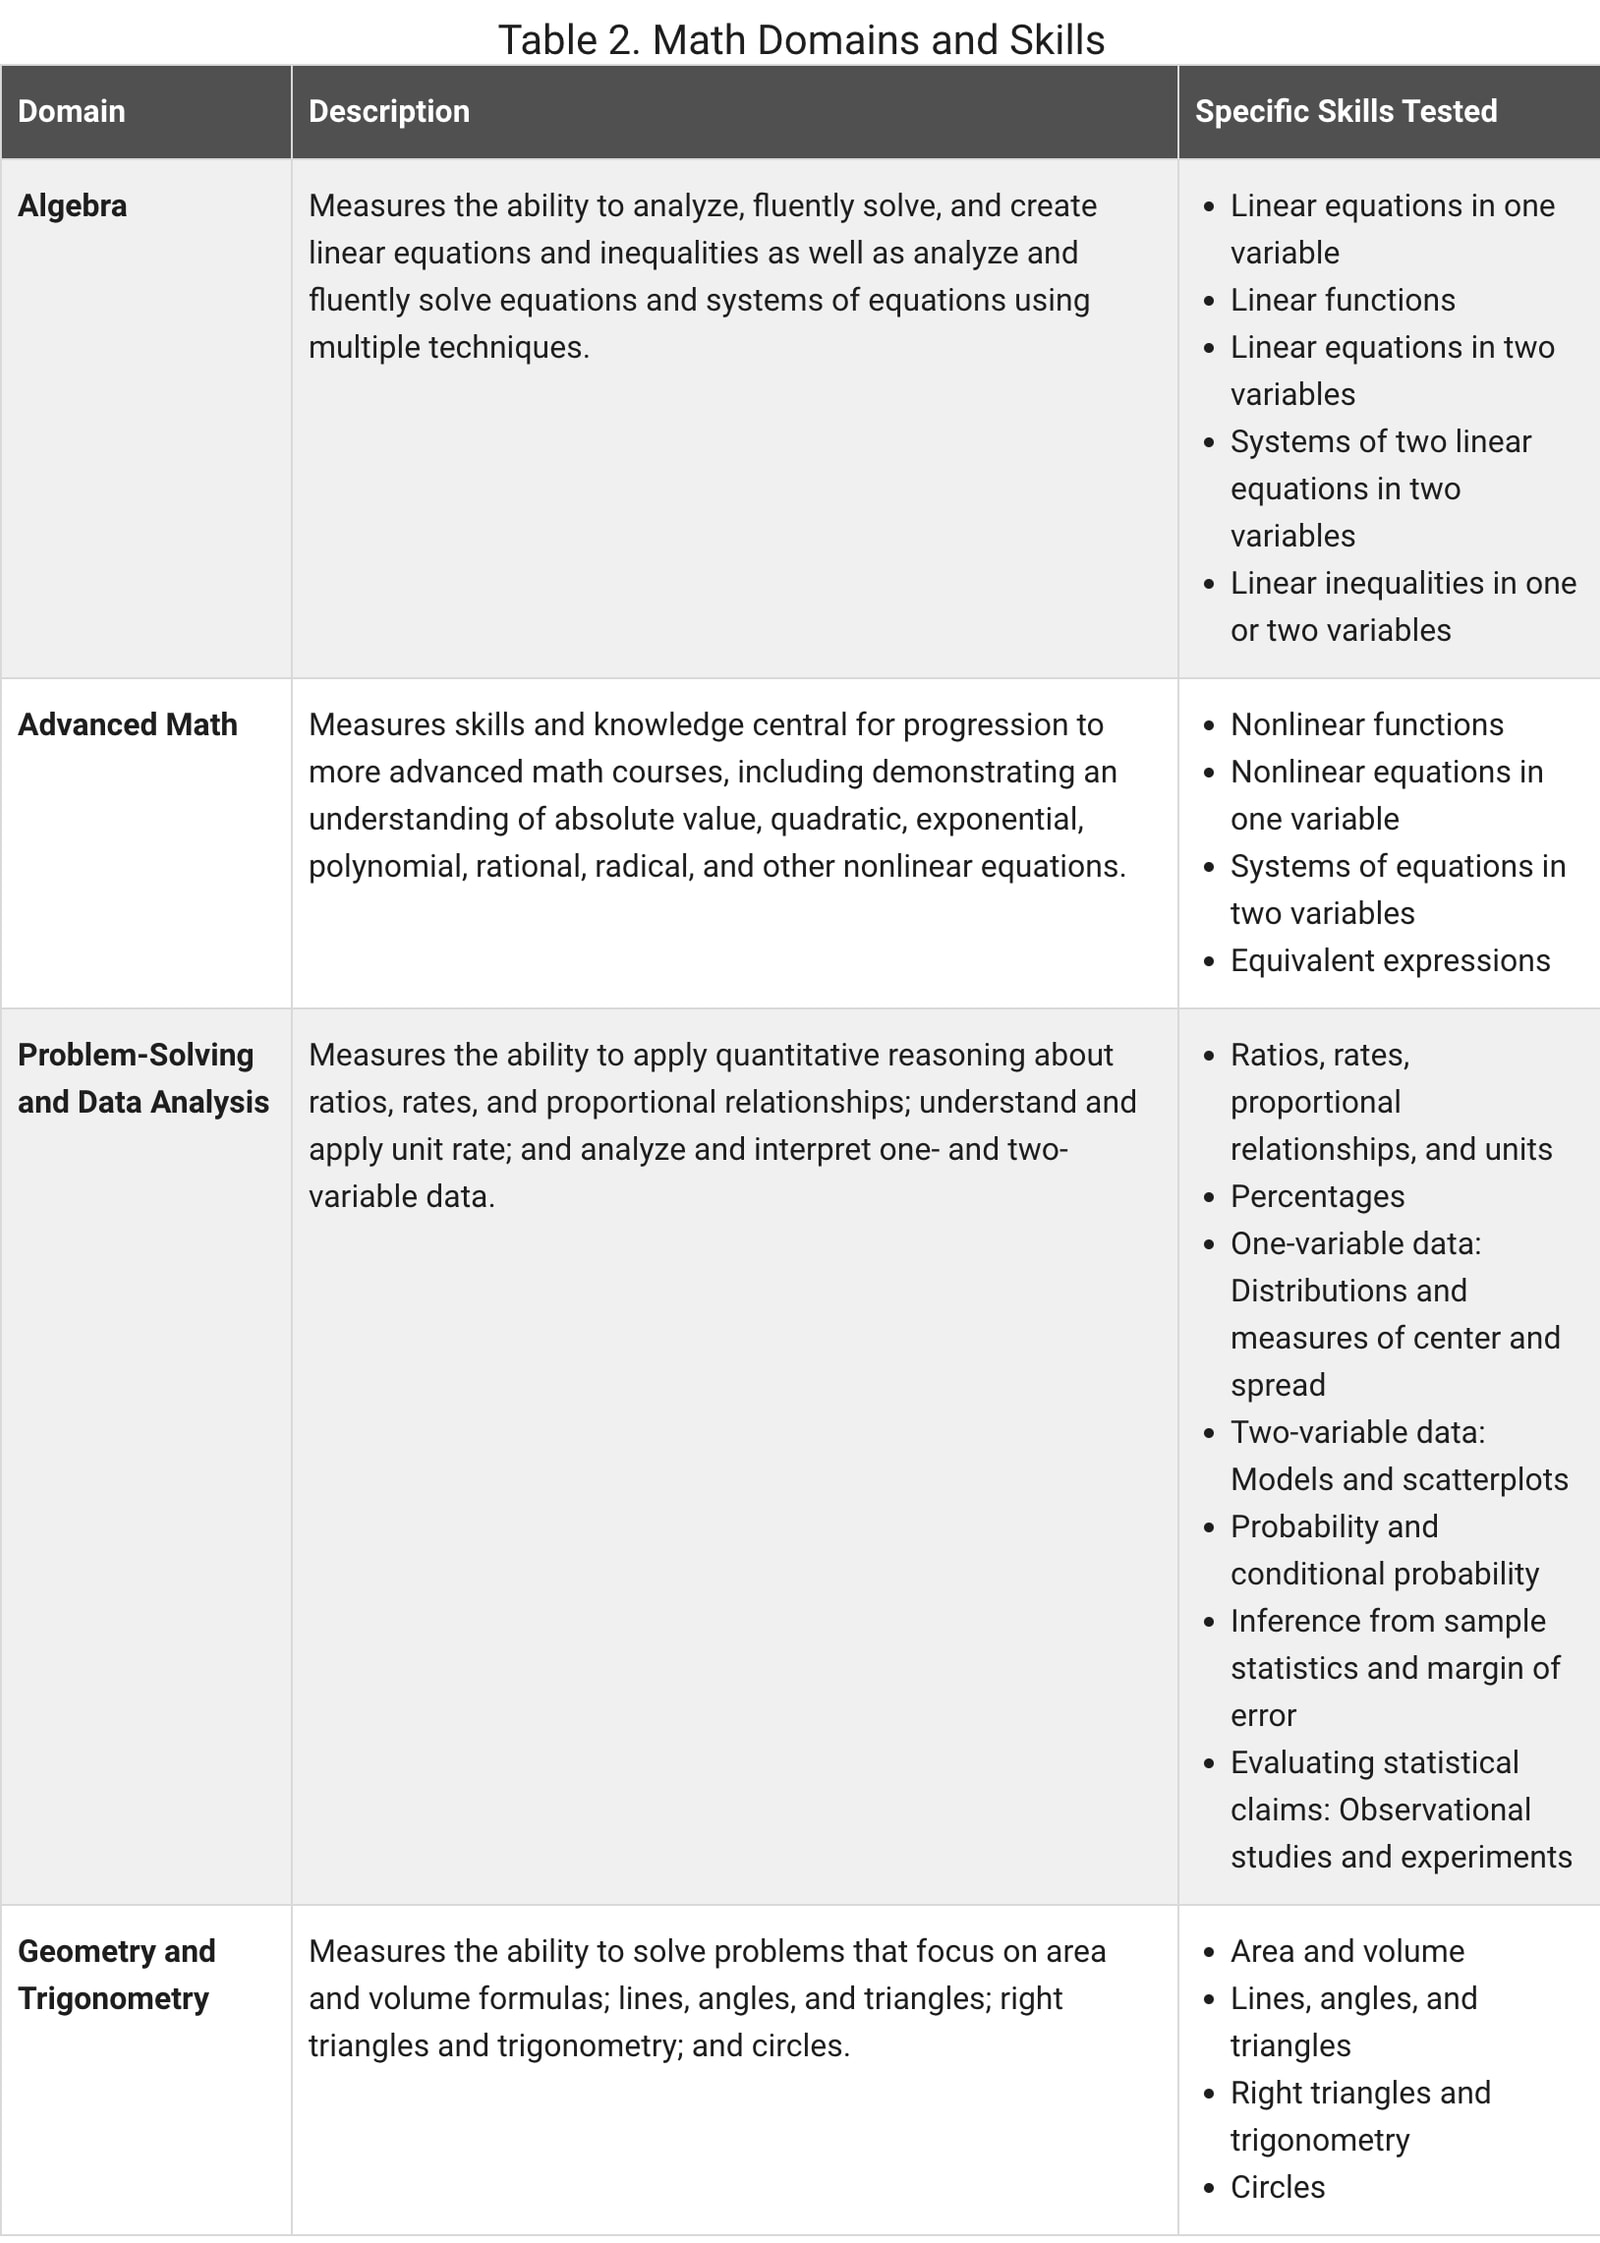
This section shows Camila a graphical progress bar in each of the 8 content domains measured on the SAT. The filled in part of each progress bar represents Camila’s level of mastery in that content domain, not her actual score. Under each content domain, Camila can also see what percentage of the test and number of questions cover that domain. The Performance range below each filled section shows Camila’s score band for that domain.For more information about content domains, visit the document parsing. Or you can refer to the following two tables.
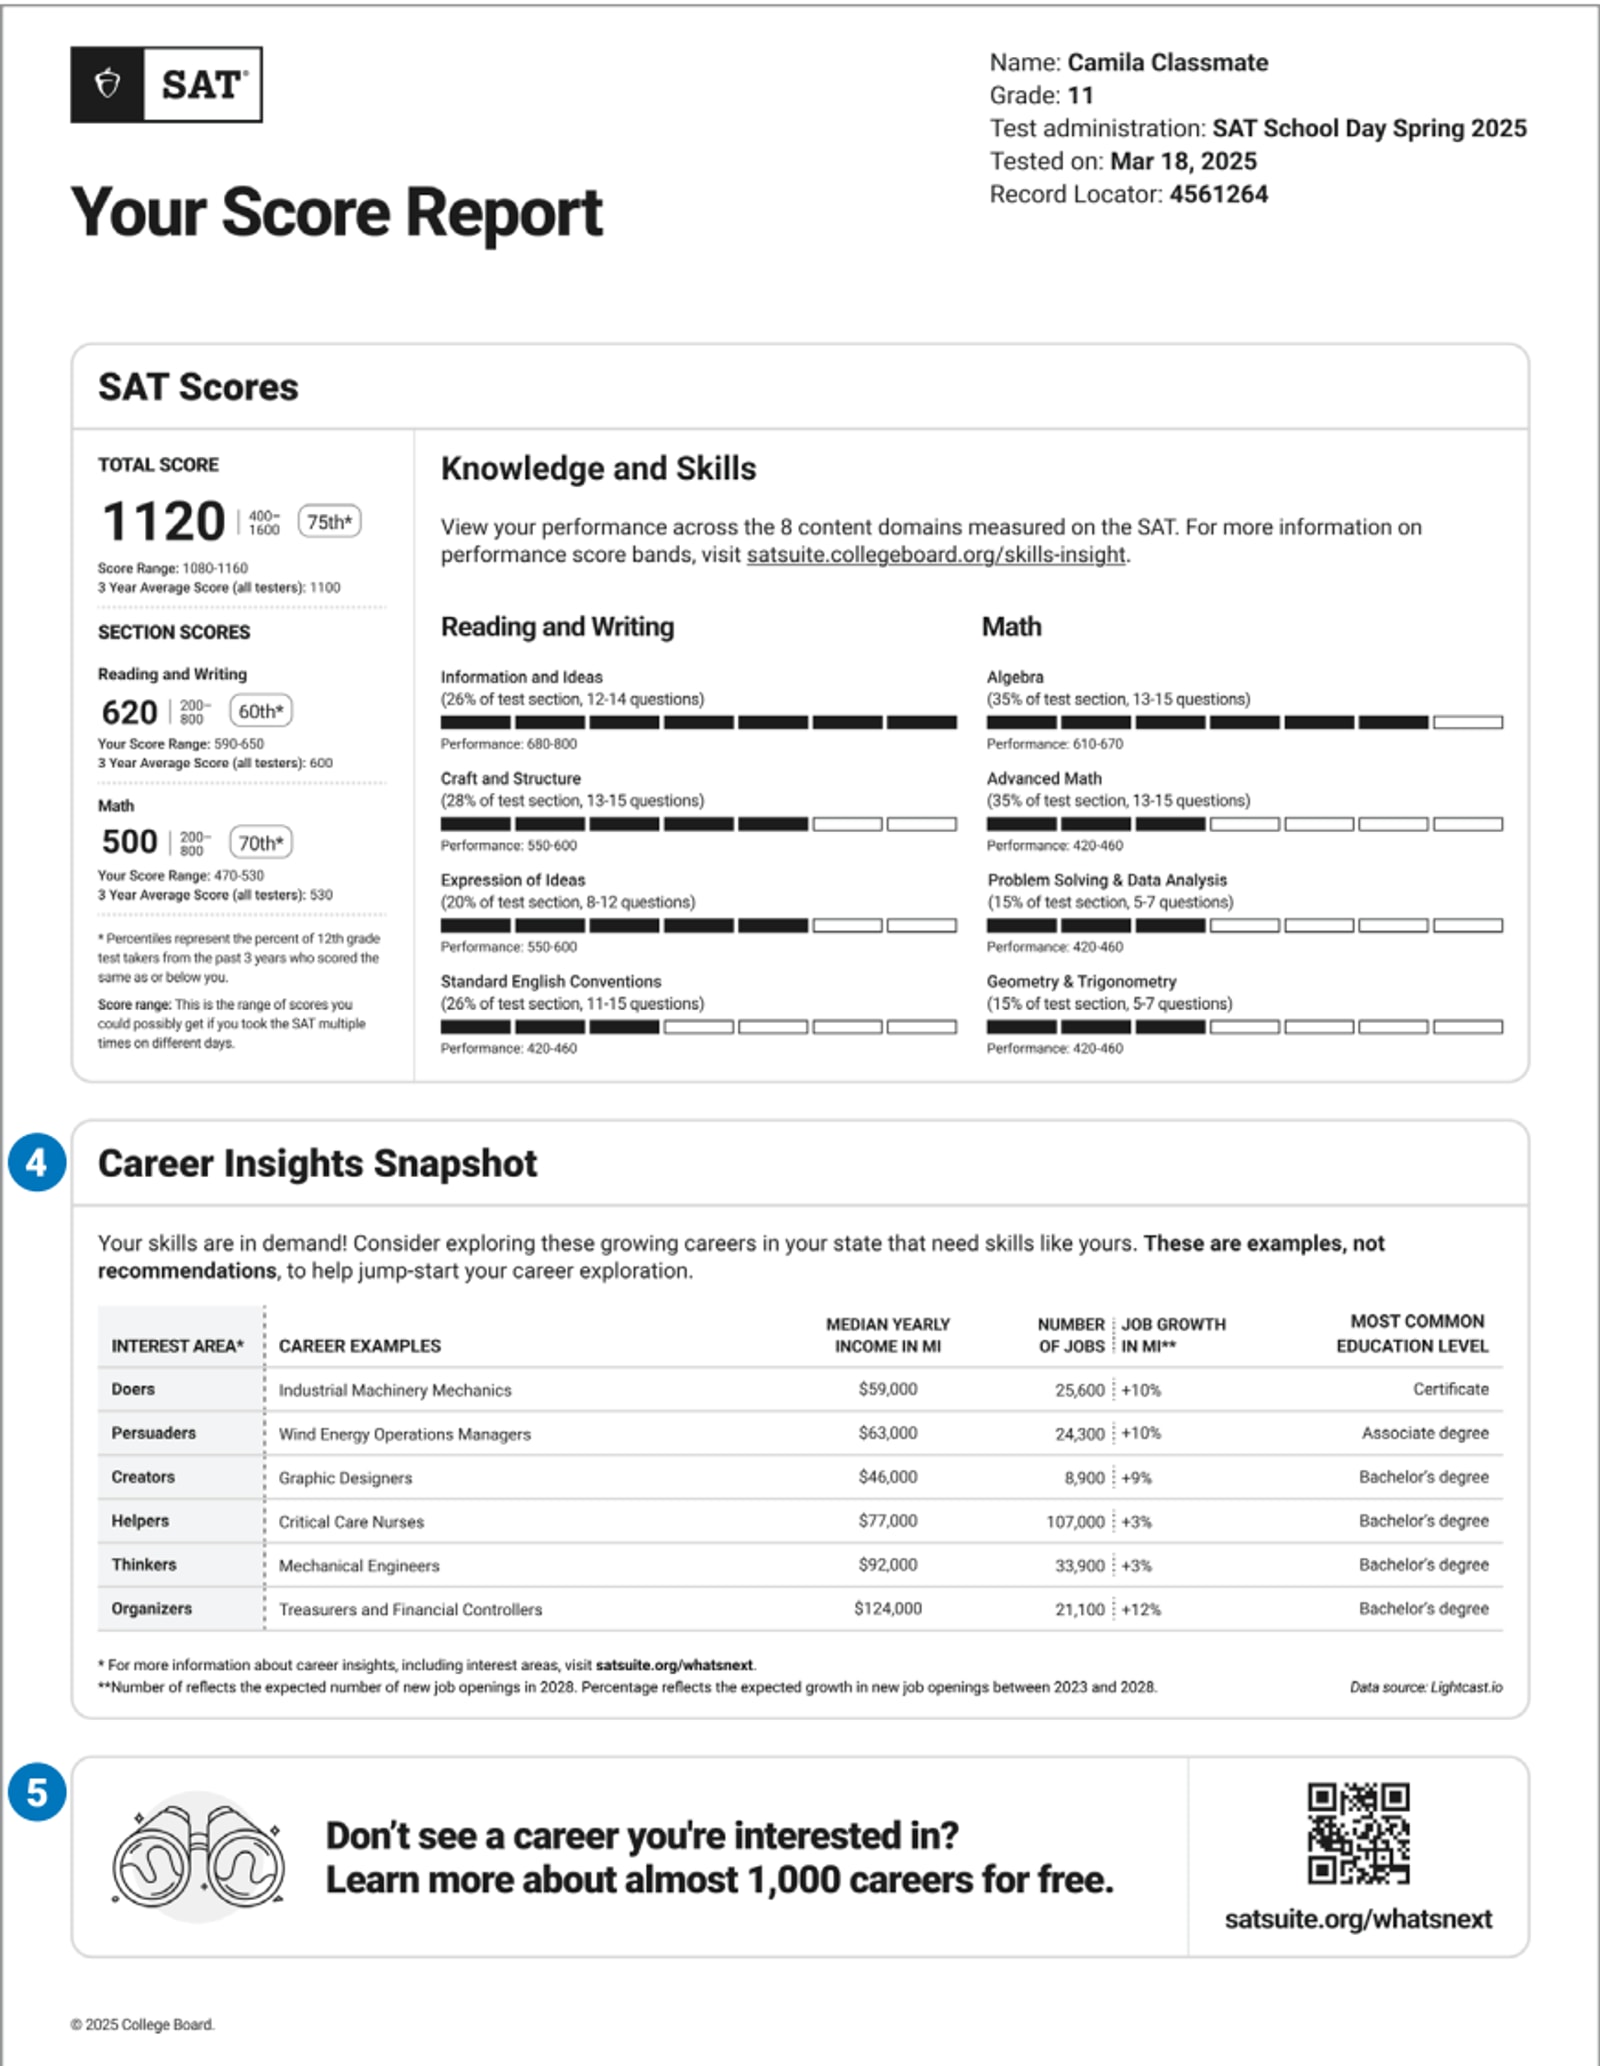
4.WHAT CAN CAMILA LEARN FROM THIS CAREER SNAPSHOT?
Since she is based in the U.S., Camila’s score report includes Career Insights Snapshot examples — helpful information about growing careers in her state that connect to her scores. Whether Camila sees a career she’s curious about or not, the examples can spark her interest in learning more about what careers are out there and provide key information like median yearly income, expected growth rate for new job openings in her state over the next 5 years, and the most common education level for people in that career. While these might be careers worth watching in Camila’s state, she can learn more about careers that reflect her interests at Career Information Network.
5.HOW CAN CAMILA LEARN MORE ABOUT HER SCORES?
If she’s under age 13, Camila can talk to her school counselor to see her full score report and learn how to prepare for future assessments in the SAT Suite. If Camila is age 13 or older, she can also visit Official results website to personally find out this information.
Overview of the Score Report PDF
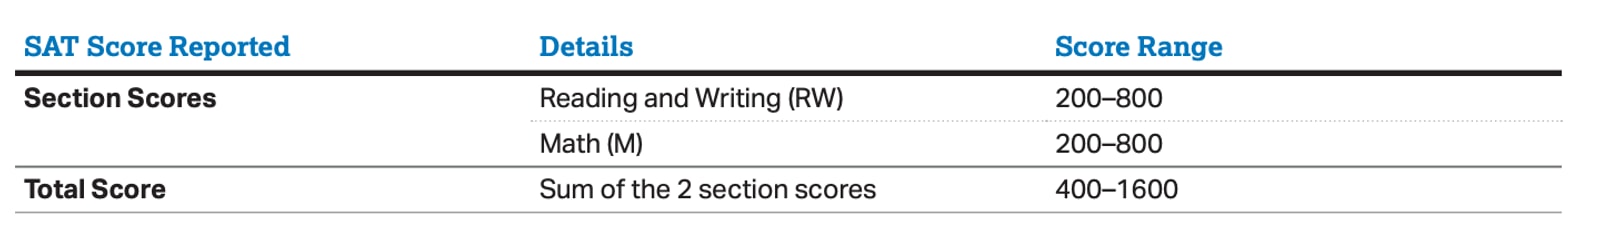
In the official score report PDF, the student can view the 3 scores available from their SAT assessment—total score, Reading and Writing section score, and Math section score.
For each score, the official score report PDF also includes:
The range of possible scores: 400–1600 for total score, and 200–800 for section scores.
The All Tester Percentile (formally called the “User Percentile”) of each score. For example, if a student’s score is in the 70th percentile, 70% of a comparison group achieved scores at or below that student’s score.
The total and section Average Score of all testers, which is based on all SAT test takers across the last 3 years.
All Tester Percentiles are based on the actual scores of the past 3 cohorts of students who took the SAT in 12th grade, for tests completed anywhere in the world.
Individual Score Ranges
A student’s ability is better represented by score ranges than points. Score ranges are derived from the standard error of measurement and show how much a student’s scores would likely vary if they took a different administration of the test under identical conditions.
Score Sends Held
If you see Score Sends Held at the top of your score report, it means the College Board was unable to confirm that a complete set of responses was available when the test was scored. Incomplete responses could negatively affect your scores, and they will not report them to colleges, universities, or scholarship programs unless you contact them to request otherwise.
Knowledge and Skills
Students can view a graphic showing their performance on each of the 8 content domains measured on the SAT. There are 4 content domains in Reading and Writing, and 4 in Math.
In each content domain, students can view:
- The approximate number of questions in the content domain and what percentage of the section that represents (e.g., 12–14 Information and Ideas questions would be about 26% of the Reading and Writing section).
- A visual indication of how the student performed in each content domain and the associated score band.
Students can use this section to identify content domains they may want to focus on to practice and improve.
Additional Support
The score report includes a Career Insights Snapshot, a list of growing careers in a student’s state that connect to their scores. These careers are examples, not recommendations, and can inspire career exploration throughout high school.
The last section of the score report PDF focuses on next steps the student can take after reviewing their scores. A QR code or link will provide them more information on tools and services related to these next steps, which include reviewing additional insights on their scores, Official Digital SAT Prep on Khan Academy®, and college and career exploration.
Benchmarks
SAT Grade-Level Benchmarks
WHAT THE BENCHMARKS MEAN
The College and Career Readiness Benchmarks for the SAT predict a 75% likelihood of achieving a C or higher in related first semester, credit-bearing college courses. The benchmarks are set at the section level, so there is a benchmark for Reading and Writing and a benchmark for Math. If students meet or exceed this benchmark in grades 8–12, they are considered on track to be college ready.
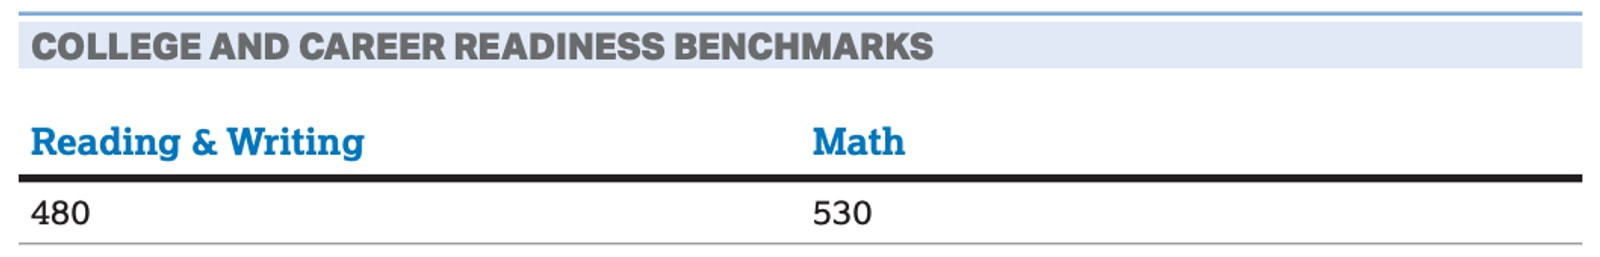
Through the online K–12 score reporting portal, the SAT reports separate benchmarks for students in 11th grade and 12th grade to help teachers understand students’ level of readiness for college and career training programs. Equipped with this information, teachers can address challenging areas for their students while there is still time for improvement. Teachers can also accelerate the progress of students who meet or exceed the benchmarks.
How to Use Scores
How Students May Send Their Scores
Students will have the opportunity when they take the SAT to choose up to 4 colleges, universities, or scholarship programs to receive their scores from that day’s test for free. College Board share with their school and district the names of the organizations they select for their 4 free score sends. Students may make their free selections during testing or within 3 days after testing. Students can also select additional institutions to share their score with later online, but they’ll have to pay for each score report they send (unless they’re eligible for a fee waiver).
In certain college and university systems, once a student submits their score to 1 school, other schools within that system will also have access to that score. Please note, however, that if they are applying to more than 1 school within a college or university system, it is still important for them to send their SAT scores to each individual school. If they are not sure whether the specific school they are applying to is part of such a system, they should contact the school’s admissions office.
When a student requests that the College Board sends their scores to colleges or other organizations as directed by them during school day testing, the College Board sends their scores along with demographic information sufficient for identity matching to those colleges and organizations, who may then use it to support their applications to those organizations.
The scores the student receives and the score reports received by colleges and their high school contain total and section scores. Additional score sends include all their available scores unless they choose otherwise, as explained further in the SAT School Day Student Guide. College Board doesn’t use their reported scaled score by itself or in combination with any other information to predict their individual future academic performance at specific postsecondary institutions. However, College Board does help individual colleges and universities use and interpret SAT scores.
How Students and Families May Use Scores
Families can:
- Help your student think of ways to develop each of the skills they have identified for focus and improvement. Khan Academy can help supplement this work, and when your student is ready, they can take practice tests on Bluebook and review the results on My Practice to understand what their practice scores mean.
- Use the career examples to talk about career interests and options with your student.
- Compare your student’s scores to the grade-level benchmarks together.
-- If your student is meeting the benchmark for a section, remind them to continue to take rigorous courses and work hard to stay on track for college success.
-- If your student is not meeting the benchmark for a section, work with their teacher to connect them to classroom work that is focused on areas that need improvement.
Benchmarks shouldn’t be used to assign academic tracks, to discourage students from pursuing college, or to keep students from participating in challenging courses. Rather, the benchmarks are intended to help all students better prepare for life after high school.
How Schools May Use Scores
Through K–12 score reporting portal, educators can access the official downloadable score report PDF for printing and sharing with the student. Educators can also see additional interpretive insights about the student’s results. The PDF, titled Your Score Report, (See sample transcript above) clearly summarizes a student’s current achievement levels and encourages next steps to increase college and career readiness. Teachers can review the official score report PDFs with students to help them understand what their scores mean. Reviewing their scores can also help students see their strengths, which can increase their confidence and help them identify content domains in which they can handle more advanced coursework.
Related Posts
Learn how the digital SAT score report simplifies performance metrics, offers visual tools, and helps you focus your prep for top scores.

Stay ahead of the curve! Learn smart strategies for tackling the Digital SAT Test and making the most of Bluebook’s features.